
Yesterday the Centers for Medicare & Medicaid Services (CMS) published their projections for National Health Expenditure, covering 2016-2025. Some numbers are floating around the news and social media, and these are the numbers that your lawmakers will (probably) be looking at as they propose healthcare spending legislation. If you’d like to see how accurate those numbers are, here is the report and the data tables for these projections.
Curious about how these projections stack up compared to the years since 1960? Have no fear, the CMS has you covered, summaries and data tables are available.
The projection tables include things like projected population, projected GDP, projected Medicare/Medicaid costs, and even details like projected costs for hospitalization vs medications, so the numbers are sliceable, diceable, and comparable in various ways.
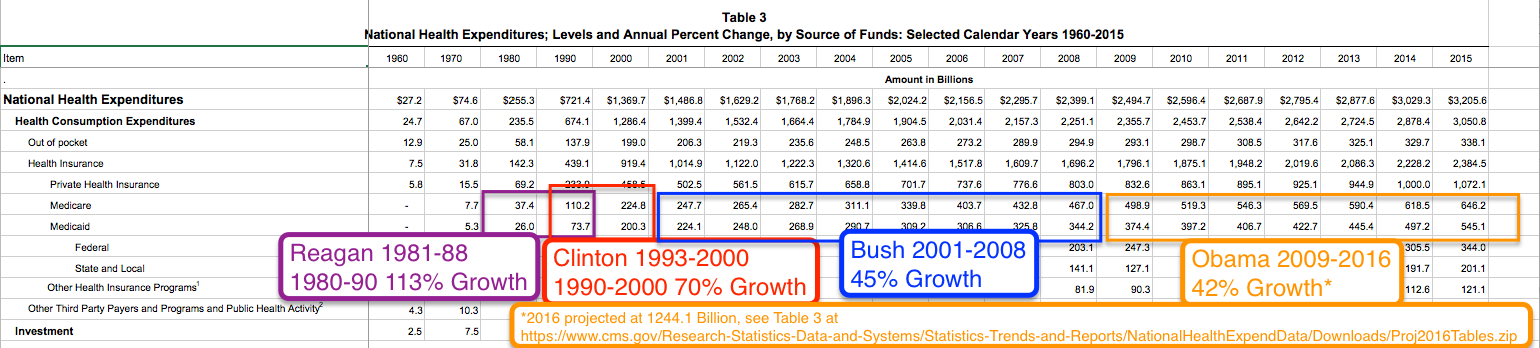
Just to illustrate how you might build context around these numbers, here’s one way of looking at the table laying out total health expenditures (not just Medicare/Medicaid) from 1960-2015 (click to enlarge):

And then there’s a similar chart for Medicare and Medicaid spending over the same time periods (click to enlarge):
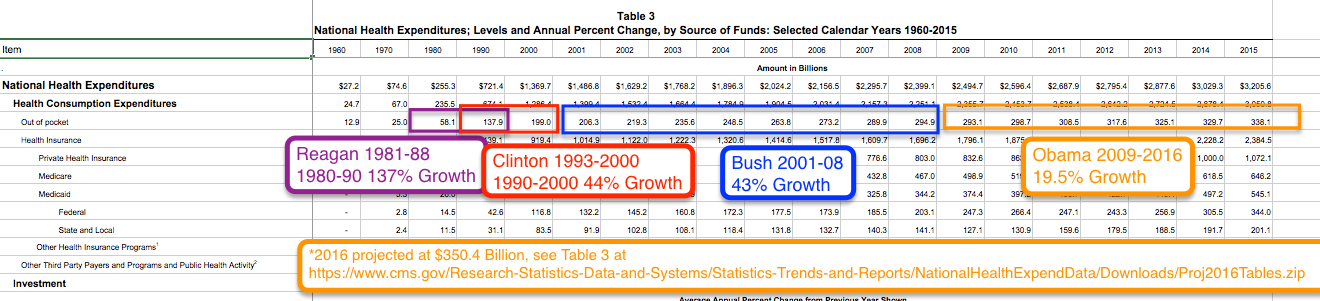
And finally, here’s a similar chart for people’s Out-of-Pocket spending over the same time period (click to enlarge):
[…] wrote previously about data that the federal government released about historical and projected health care spending, including both the price tags for the […]